Monolithe Rack
Measurement on the Frontend Node
Warning
To use ncm-board you need to be in the dialout group. This is not
automatic, please ask an administrator if you need it.
The power measurements are performed on the frontend node. To run a measurement, simply run the command:
By replacing X by the number of the measurement platform or by replacing
boardX by its short name, according to the following table (see the
Summary Table for more details):
| Board Full Name | Node Name | NCM Board no | Comments |
|---|---|---|---|
| Jetson AGX Xavier | mono-jts-xagx |
1 | |
| Jetson Xavier Nano | mono-jts-nano |
2 | |
| VIM1S | mono-vim-1s |
3 | Currently being recalibrated (PSESI) |
| Banana Pi F3 | mono-bpi-f3 |
4 | |
| Odroid-XU4 | mono-oxu-4 |
5 | |
| Raspberry Pi 4 Model B | mono-rpi-4b |
6 | |
| Orange Pi 5 Plus | mono-opi-5p |
7 | |
| Jetson AGX Orin | mono-jts-oagx |
8 | |
| Jetson Orin Nano | mono-jts-onano |
9 |
Warning
We noticed that the calibration of boards 2, 3, 5, 6, 7, 8 & 9 might be wrong (around 20% of error). A new calibration will be achieved early in September 2024. Boards 1 & 4 have been calibrated recently (07/2024).
Info
Note that some of the SBCs are not powered by a measurement platforms. Thus, it is not possible to measure the overall energy/power on these SBCs.
Output file of the command board boardX measure is structure as followed:
cal_data: cal_data 3489 0.4980 3637 1.0000 3946 2.0030 3905 4.7130 3374 5.0110 3584 12.011 3409 20.024
cr 3489 ca 0.498000
cr 3637 ca 1.000000
cr 3946 ca 2.003000
cr 3905 ca 4.713000
vr 3374 vv 5.011000
vr 3584 vv 12.011000
vr 3409 vv 20.024000
cal_data selected: 3905.000000 4.713000, 3409.000000 20.024000
  0 0.795356 18.927303 15.053953
  0 0.847254 18.932138 16.040325
  0 0.806219 18.932959 15.264104
  0 0.805012 18.932983 15.241274
  0 0.899151 18.931101 17.021919
  0 1.097085 18.921268 20.758240
  0 0.931738 18.924576 17.632742
  0 1.019842 18.922813 19.298286
  0 0.825529 18.938446 15.634242
...
The measures are on the lines starting with two spaces and a bit (here set to 0) which can be used to profile an application during its evaluation. First float value is intensity (A), second value is voltage (V) and third one is instantaneous power (W).
Power from Hardware Counters
Jetson Power Tools
Some of the boards come with some useful tools that allow for example to monitor power consumption, CPU frequencies etc.
Jetson Power GUI
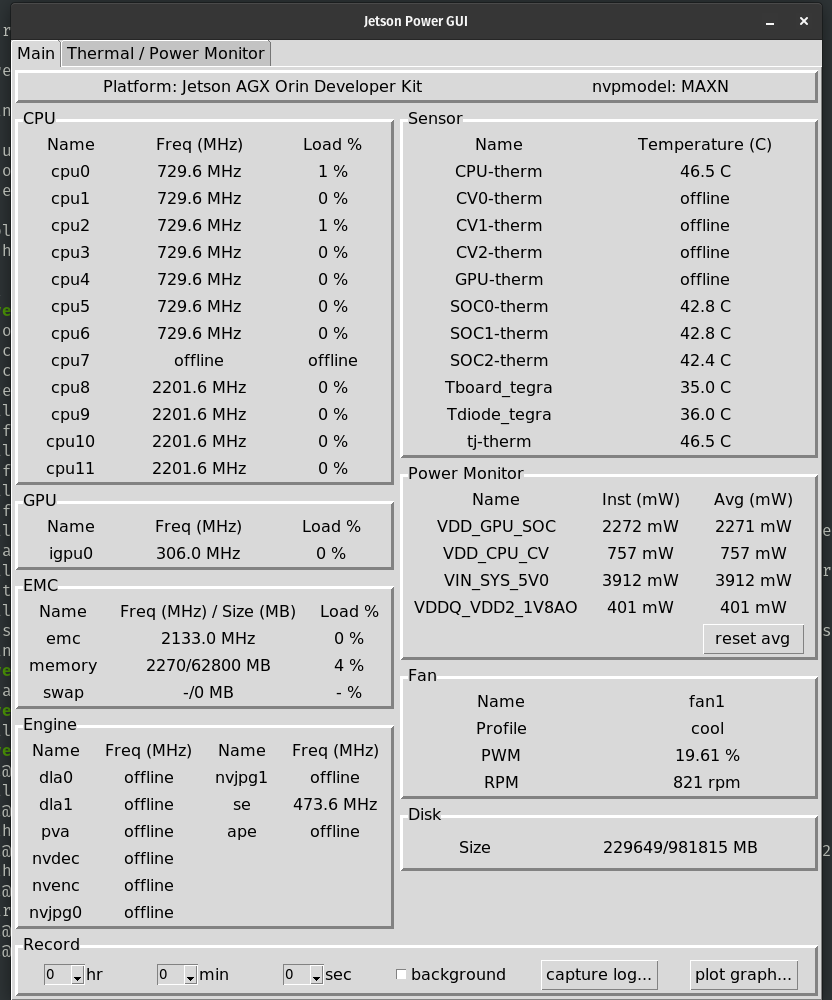
A native tool is Jetson Power GUI, which allows to monitor a lot of useful
parameters. To run it via ssh, you need to allow X11 forwarding by including the
-X argument in your ssh command. Then you can run the application with the
following command:
Warning
Note that if you don't run the application as an administrator, the application should start but power monitoring may not work.
Warning
If you get the error X11 connection rejected because of wrong
authentication., you need to update the root/.Xauthority file:
To do so, copy the line returned by the command:
Then, log as root and add the line to .Xauthority via the command
xauth add:
Measuring Hardware Counters "by hand"
It is possible to get the measures provided by Jetson Power GUI directly using python running as administrator.
For example, you can do:
# start python as administrator
$ sudo python
# import the jetsonpower lib
>>> from pylibjetsonpower import *
# get the names of the counters of the measurement rail
>>> rail_get_names()
['VDD_IN', 'VDD_CPU_GPU_CV', 'VDD_SOC']
# print the value of the power counter
>>> rail_get_power('VDD_CPU_GPU_CV')
554
Some other python functions are:
rail_get_warn_current(name)
rail_get_crit_current(name)
rail_get_voltage(name)
rail_get_current(name)
rail_get_power(name)
rail_get_avg_power(name)
Info
You can find other examples of the usage of this library in the code of
Jetson Power GUI, in the directory: /usr/share/jetsonpowergui
Powerstat on x86 CPUs
On the Mercury EM780 (mono-em780) the previous command will produce:
Running for 60.0 seconds (30 samples at 2.0 second intervals).
Power measurements will start in 0 seconds time.

  Time    User  Nice   Sys  Idle    IO  Run Ctxt/s  IRQ/s  Watts   pkg-0   core  CPU Freq  Freq Min  Freq Max
13:03:51   0.0   0.0   0.0 100.0   0.0    1     42    104   2.57    2.57   0.00  0.47 GHz  0.40 GHz  1.40 GHz
13:03:53   0.0   0.0   0.0 100.0   0.0    1     52    124   2.58    2.58   0.00  0.48 GHz  0.40 GHz  2.07 GHz
13:03:55   0.0   0.0   0.0  99.8   0.2    1     52    127   2.58    2.58   0.00  0.43 GHz  0.40 GHz  1.40 GHz
13:03:57   0.0   0.0   0.0 100.0   0.0    1     48    108   2.56    2.56   0.00  0.43 GHz  0.40 GHz  1.40 GHz
13:03:59   0.0   0.0   0.0  99.8   0.2    1     36     98   2.56    2.56   0.00  0.48 GHz  0.40 GHz  2.04 GHz
13:04:01   0.0   0.0   0.0 100.0   0.0    1     46    112   2.57    2.57   0.00  0.47 GHz  0.40 GHz  1.41 GHz
13:04:03   0.0   0.0   0.0 100.0   0.0    1     30     92   2.56    2.56   0.00  0.48 GHz  0.40 GHz  2.41 GHz
13:04:05   0.0   0.0   0.0 100.0   0.0    1     48    121   2.59    2.59   0.00  0.43 GHz  0.40 GHz  1.40 GHz
13:04:07   0.0   0.0   0.0 100.0   0.0    1     33     99   2.58    2.58   0.00  0.44 GHz  0.40 GHz  1.84 GHz
-------- ----- ----- ----- ----- ----- ---- ------ ------ ------  ------ ------ --------- --------- ---------
 Average   0.0   0.0   0.0 100.0   0.0  1.0   43.1  109.4   2.57    2.57   0.00  0.46 GHz  0.40 GHz  1.71 GHz
 GeoMean   0.0   0.0   0.0 100.0   0.0  1.0   42.3  108.8   2.57    2.57   0.00  0.46 GHz  0.40 GHz  1.67 GHz
  StdDev   0.0   0.0   0.0   0.1   0.1  0.0    7.9   11.8   0.01    0.01   0.00  0.02 GHz   N/A      0.37 GHz
-------- ----- ----- ----- ----- ----- ---- ------ ------ ------  ------ ------ --------- --------- ---------
 Minimum   0.0   0.0   0.0  99.8   0.0  1.0   29.5   91.5   2.56    2.56   0.00  0.43 GHz  0.40 GHz  1.40 GHz
 Maximum   0.0   0.0   0.0 100.0   0.2  1.0   52.0  127.0   2.59    2.59   0.00  0.48 GHz  0.40 GHz  2.41 GHz
-------- ----- ----- ----- ----- ----- ---- ------ ------ ------  ------ ------ --------- --------- ---------
Summary:
CPU:   2.57 Watts on average with standard deviation 0.01
Note: power read from RAPL domains: pkg-0, core.
These readings do not cover all the hardware in this device.

C-State    Resident      Count Latency
C3          95.755%       1853     350
C2           0.039%        182      18
C1           0.000%         29       1
POLL         0.000%         13       0
C0           4.206%

Histogram (of 9 power measurements)

Range (Watts) Count
2.558 - 2.560     1 ####################
2.561 - 2.564     2 ########################################
2.565 - 2.567     0
2.568 - 2.570     2 ########################################
2.571 - 2.574     0
2.575 - 2.577     1 ####################
2.578 - 2.580     2 ########################################
2.581 - 2.584     0
2.585 - 2.587     0
2.588 - 2.590     1 ####################

Histogram (of 9 CPU utilization measurements)

Range (%CPU)  Count
0.000 - 0.018     6 ########################################
0.019 - 0.037     1 ######
0.038 - 0.055     0
0.056 - 0.074     0
0.075 - 0.093     0
0.094 - 0.112     0
0.113 - 0.130     0
0.131 - 0.149     0
0.150 - 0.168     0
0.169 - 0.187     2 #############

Histogram (of 9 CPU average frequencies)

Range (GHz)   Count
0.433 - 0.437     3 ########################################
0.438 - 0.442     1 #############
0.443 - 0.447     0
0.448 - 0.452     0
0.453 - 0.457     0
0.458 - 0.463     0
0.464 - 0.468     2 ##########################
0.469 - 0.473     0
0.474 - 0.478     1 #############
0.479 - 0.483     2 ##########################